The Honeycomb Cycle is a graphical/economic model devised by three Dutch scholars1 in 1994 to describe the reaction of the real estate market to the factors of price and number of purchases/sales.
It can be defined as a model that graphically represents the “anomalous” behavior of the real estate market compared to other markets, an anomaly that is given by the intrinsic characteristics of this specific market, consisting of durability, uniqueness and, above all, non-reactivity (or “inertia”).
In particular, the accentuated non-reactivity of the real estate market means that prices do not respond quickly to changes in demand and vice versa. Instead, the model suggests corrections and reactions that are slowly following each other in a cyclical course.
The honeycomb cycle is characterized by six phases which have been found in the history of real estate transactions with repeated interactions.
We start by choice with the “stability” phase (Graph n. 1)2.
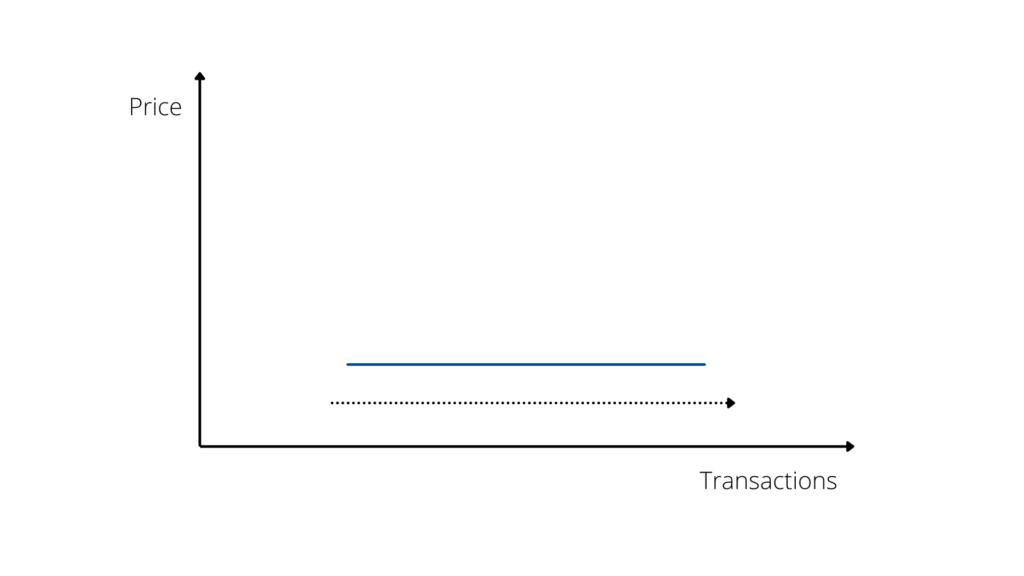
In this phase, there is an increase in the number of purchases and sales – generally due to economic growth, fiscal or banking policies, increased confidence on households and investors, or other positive market factors. However, this growth in the quantity of transactions is not immediately followed by an increase in prices (as would occur in markets where there is a higher responsiveness index).
In this first phase, therefore, we see a “flat” demand line; that is, an increase in the number of sales does not correspond to an increase in the average price, which remains stable.
This is the direct consequence of the “inertia” of the market – that is, the extremely slow reactivity with which the price/quantity factors react to each other.
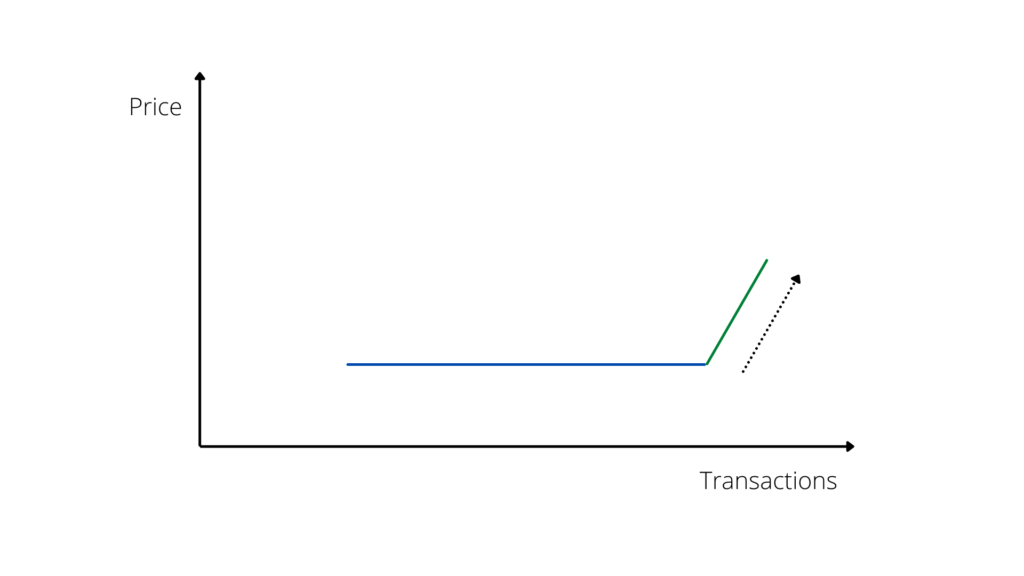
The second phase begins after a certain period of time, when the market reacts and prices begin to adjust to the increase in purchases and sales. It is true that the real estate market is characterized by poor reactivity, but poor reactivity implies a temporal waiting factor, that is, it is reflected on the timing – not on the extent – of price adjustment. Once the time of “inertia” has elapsed, normal case histories show that prices “react” and an average increase in sales values is observed.
Also, in this case, the inertia factor implies that an increase in prices does not immediately follow a decrease in sales. Therefore, in this brief phase, a joint increase is observed, both in prices and in sales, so that the demand line is set in an upward direction (Graph n. 2).
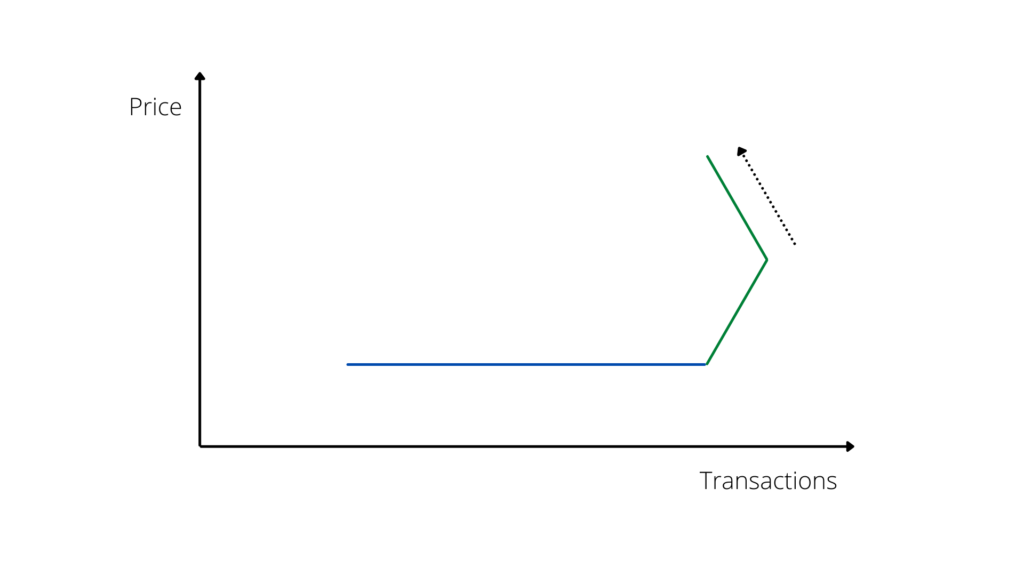
The subsequent reaction of the market with respect to the price increase – after a certain period – consists in the contraction of the number of sales, which brings us to phase three.
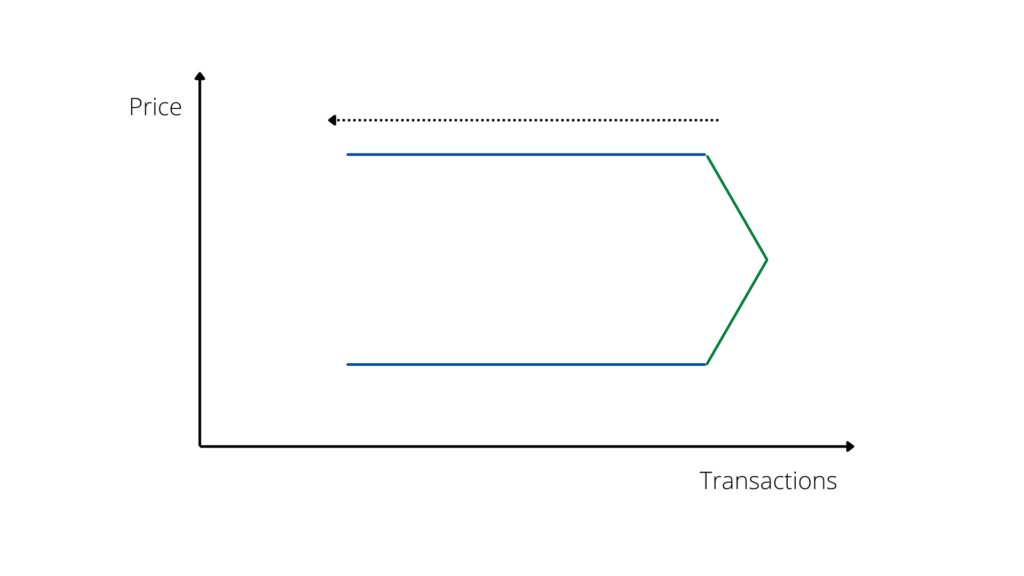
Phase 3 is characterized by a gradual decrease in the number of purchases and sales (due to the increase in prices), but not by a simultaneous correction of prices. Therefore, paradoxically, prices continue to rise despite the number of sales decreasing. The demand line is still in an upward motion, but in the opposite direction; Hence, the decrease in the number of purchases and sales still corresponds to an increase in prices (Graph n. 3).
Once the inertia of the market is over, there comes a time when prices can no longer increase since demand is decreasing, but they do not decrease abruptly due to the low reactivity of the market, so we see a phase of price stability with a gradual decrease in sales.
The decrease in sales is also due, in this phase, to a lower supply of properties, given the strong increase in transactions in the previous period.
The fourth phase is characterized by price stability with a simultaneous decrease in the number of purchases and sales (Graph n. 4).
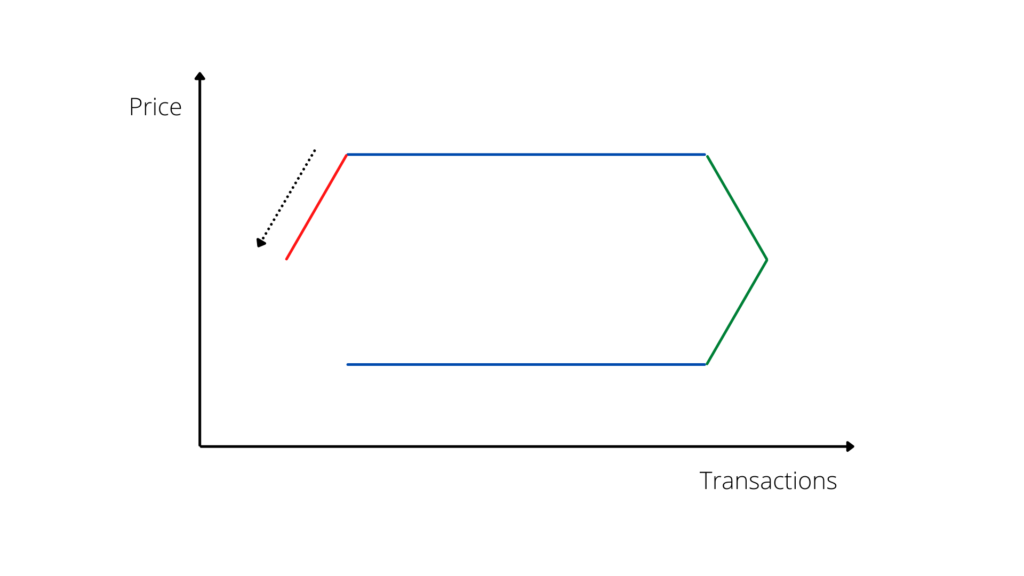
The subsequent correction of the market is a decrease in prices, exactly mirroring what happened in the second phase, and therefore a period in which, still paradoxically, a decrease in prices corresponds to a decrease in sales.
In the graphic model, the corresponding line is for the first time in a descending phase on both axes, showing a simultaneous contraction of values and number of sales (Graph n. 5).
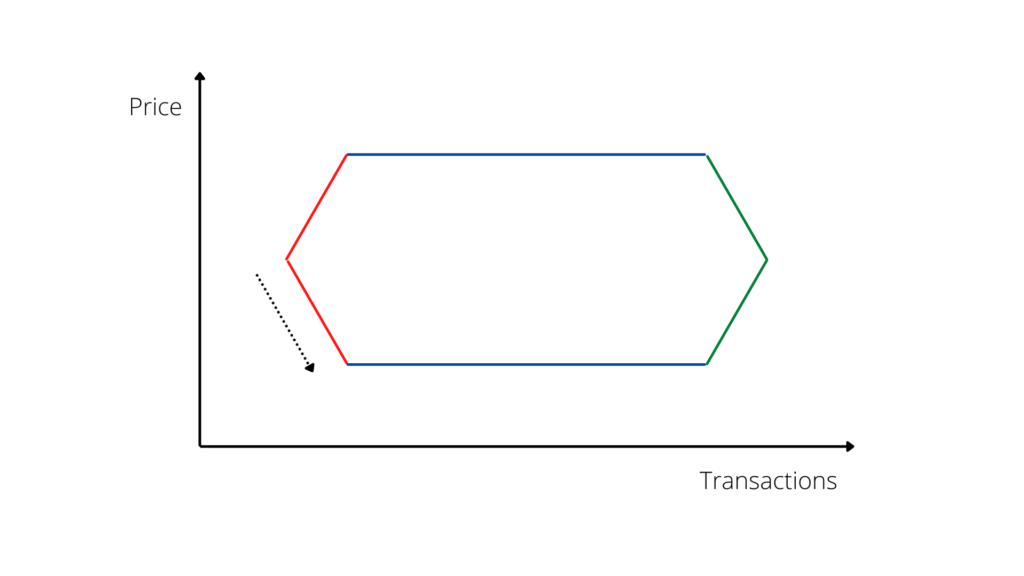
The sixth and final phase is the one in which – given the fall in prices – the number of sales begins to increase again. And so, once again, market inertia will produce a continuation of the downward trend in prices, but on the side of the number of purchases and sales, the market will react and the quantity will begin to increase.
This trend will continue for a certain period of time until reaching the initial phase in which, with a stable market, given the recovery of the economy, the number of purchases and sales will begin to rise again to stable prices (Graph n. 6).
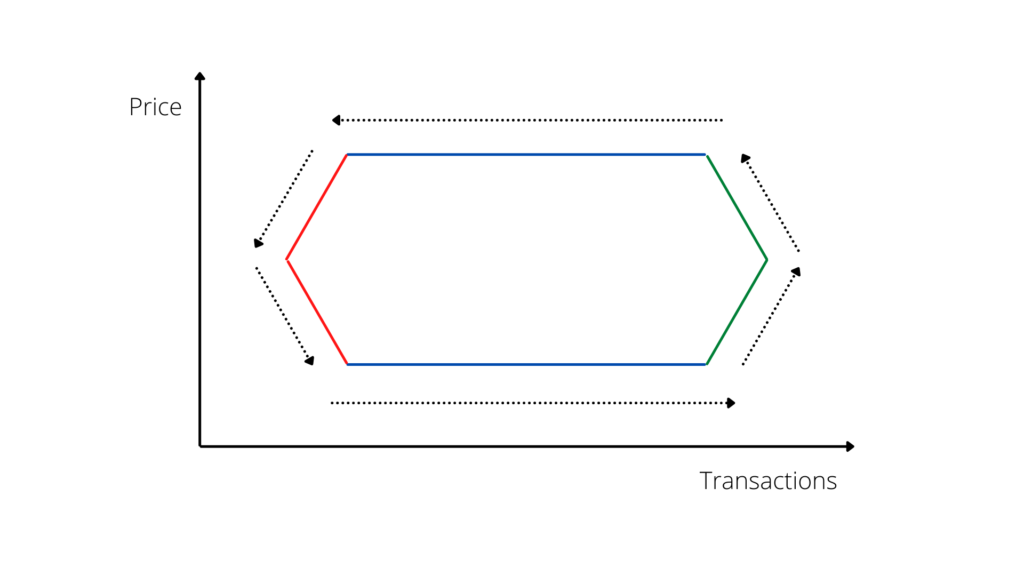
The model just described in a brief outline, although it may be general and synthetic, expresses immediately and visually a basic concept, which can be summarized as a slow “run-up” in the real estate market of one factor over another: when the number of transactions increases, the price does not react immediately, it remains stable for a certain period as if chasing the quantity on our graph; when the inertia runs out and the price average starts to respond, the trend of the number of transactions remains in its turn inert for a certain period, until it reaches the point of reaction (Graph n. 7).
And so on, cyclically.
The scheme proposed by Janssen, Kruijt and Needham is a mathematical and graphical illustration of what has happened in the recent history of real estate transactions.
The authors – in their study – take as examples the local markets of Eindhoven and Enschede, demonstrating the same cyclical trend, albeit with different data (Graph n. 8).


Other scholars and market technicians have observed the same phenomena in local markets in European countries.
In Italy, for example, a study by the Agenzia del Territorio – the institutional real estate database – has observed cyclical trends in the real estate market that are exactly in line with the honeycomb model, even though it uses very different territorial markets as a reference3.

This model (Graph n. 9), which is much more accurate and technical than what has been briefly outlined above, is actually the representation of a phenomenon that is well known to operators and has been observed throughout the recent history of real estate transactions, namely, the cyclical trend of the market and constant fluctuations, tending towards general growth.
In the absence of unforeseeable external determinants, the cyclical market trend is an interesting basis for developing hypotheses and forecasts on real estate trends.
In fact, by analyzing recent history, and knowing the real dynamics of the market, it is possible to make hypotheses regarding the phase in which we find ourselves in the present period and therefore also to hypothesize the dynamics that in a general way can be profiled for the short/medium-term future. However, this model does not take into account external factors that may have a decisive impact, such as an economic crisis in other markets, a strong recession, unexpected inflation, or other external elements that may deviate, shorten or prolong the curves of the model.
Therefore, the Honeycomb Model should always be considered as one of the useful elements for an accurate and prudent analysis, but never disregard general market and societal conditions.
1 Jos Janssen, Bert Kruijt and Barrie Needham, “The Honeycomb Cycle in Real Estate”, Journal of Real Estate Research, 1994, vol. 9, issue 2, 237-252.
2 The horizontal axis gives the number of transactions (representing in principle the “quantity” factor); the vertical axis shows the average price of the purchases and sales.
3 Festa, Ghiraldo, Storniolo, Analysis of real estate market cycles: an application to Italian data; and also, Cappellini M, Real estate market, towards recovery?